> For the complete documentation index, see [llms.txt](https://help.xpert.lever.me/llms.txt). Markdown versions of documentation pages are available by appending `.md` to page URLs; this page is available as [Markdown](https://help.xpert.lever.me/creative_center/ad_analysis/analysis/undefined.md).
# 레이블 분석
레이블 분석은 소재에 설정된 레이블을 기준으로 성과를 비교·분석하여, 어떤 요소 조합이 성과를 견인하는지 파악하는 기능입니다.
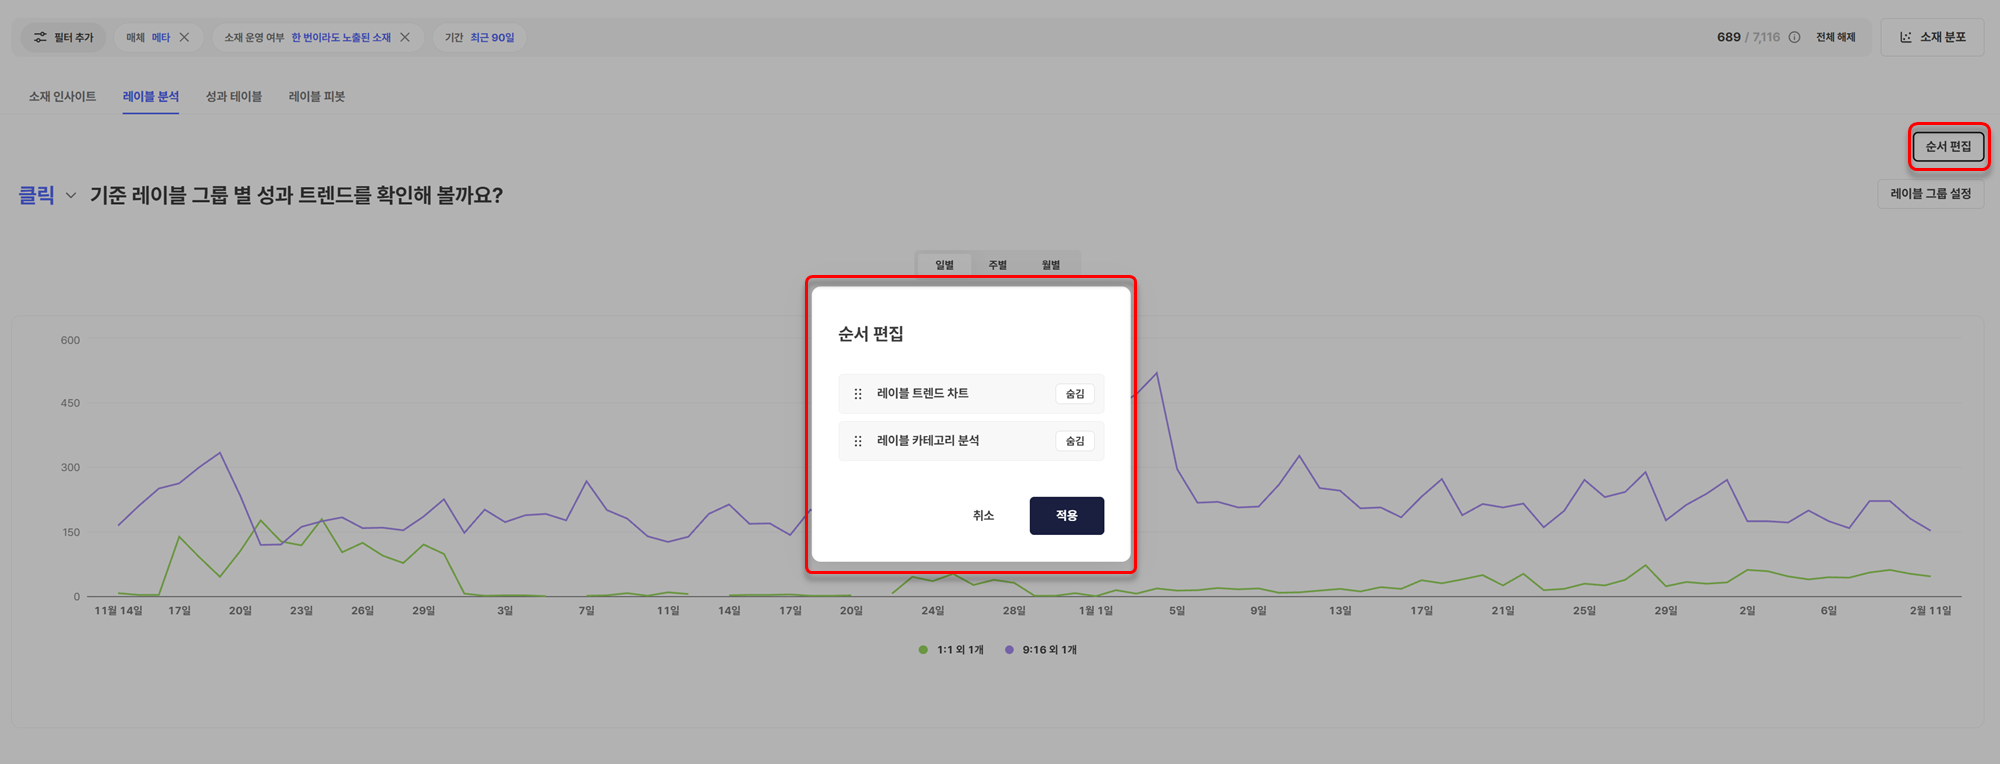
우측 \[순서 편집] 버튼을 클릭하면 인사이트 카드의 노출 순서를 변경하거나, 특정 카드를 숨김 처리할 수 있습니다.
현재 제공되는 인사이트 카드는 다음과 같습니다.
* 레이블 트렌드 차트
* 레이블 카테고리 분석
***
## 레이블 분석 구성
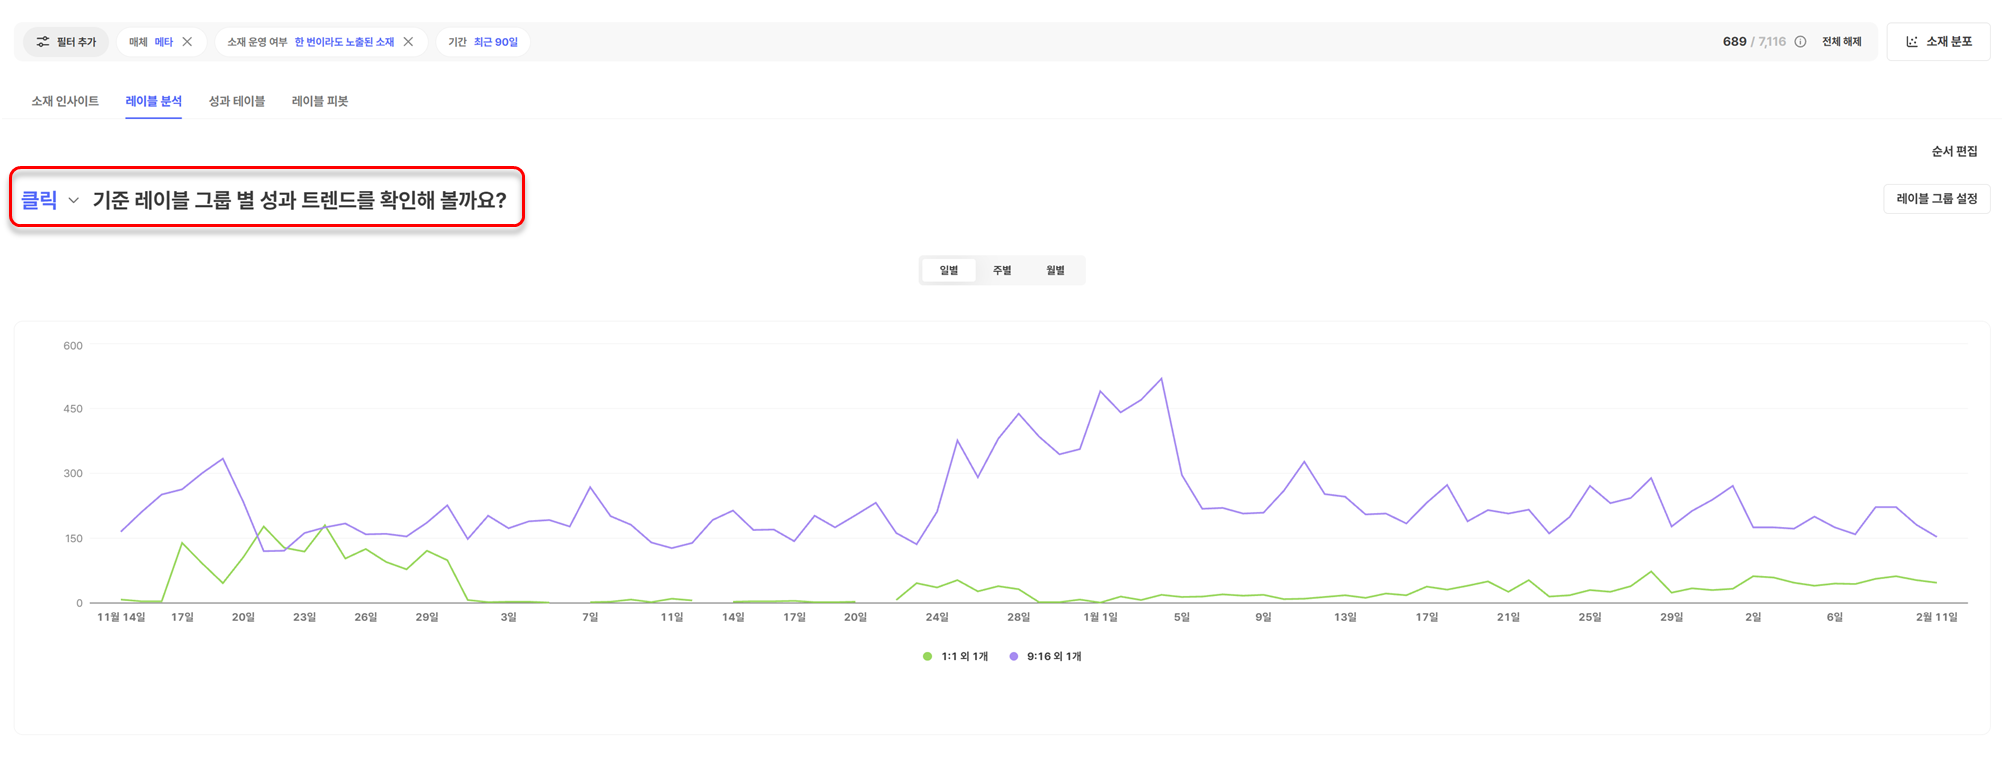
#### 레이블 트렌드 차트
* 레이블 그룹 단위로 일별 / 주별 / 월별기준지표 성과 추이를 비교해, 어떤 레이블 조합이 성과를 만들고 있는지 확인합니다.
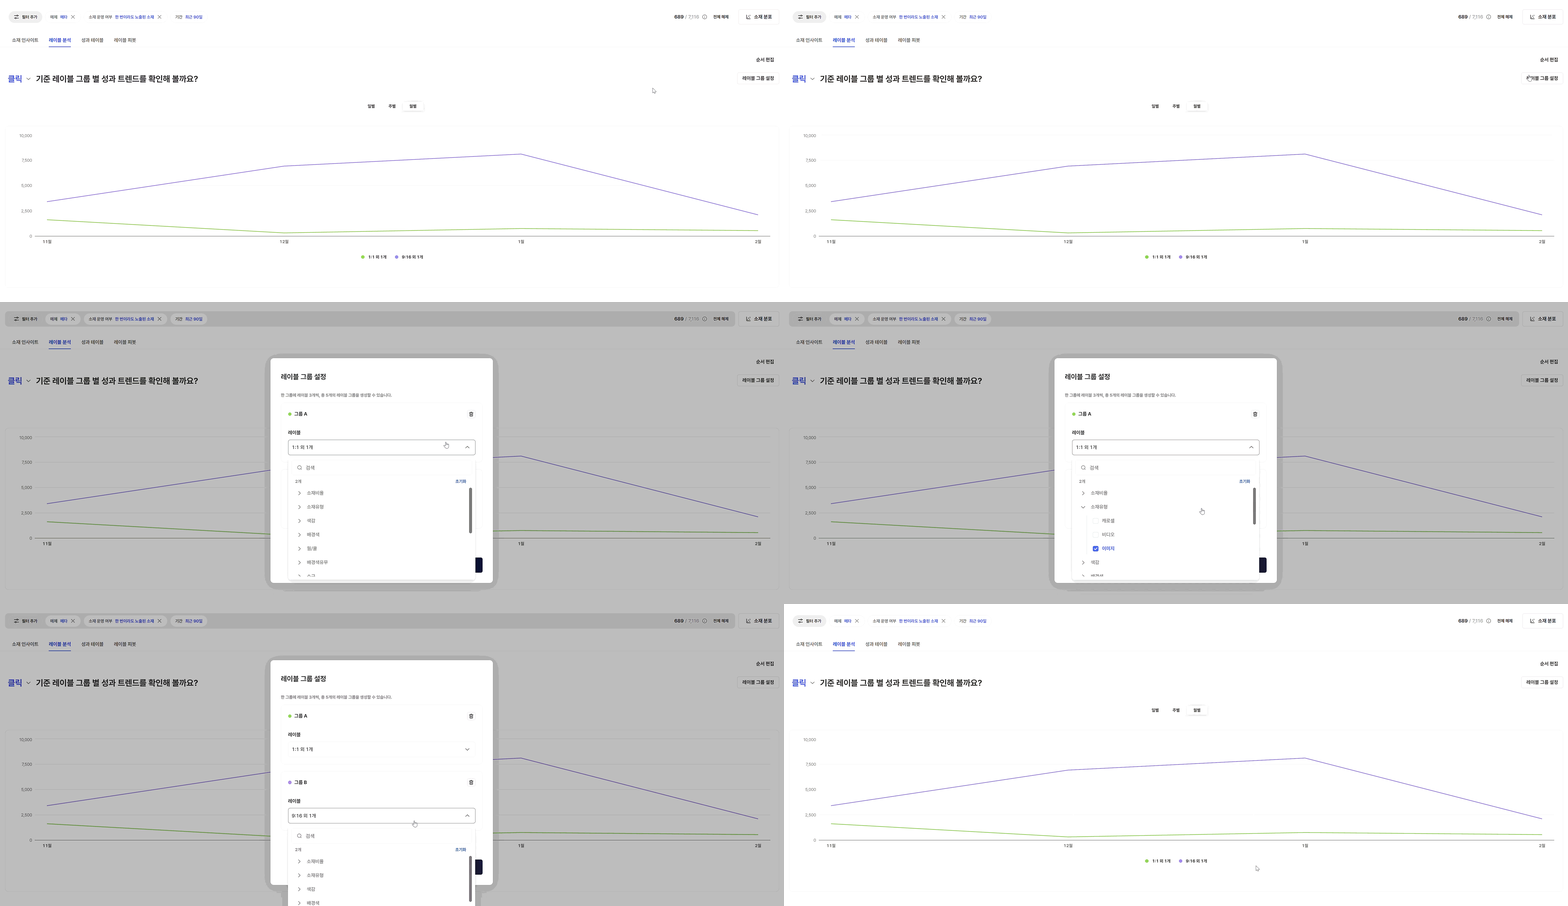
* 우측 **\[레이블 그룹 설정]** 버튼을 클릭하여, 성과를 비교하고자 하는 레이블을 그룹 단위로 구성할 수 있습니다.
* 예) **A 그룹**: `소재비율` 1:1 + `소재유형` 이미지 조합 v.s **B 그룹**: `소재비율` 9:16 + `소재유형` 비디오 조합
* 최대 **5개 그룹**까지 생성 가능하며, 각 그룹당 **최대 3개의 레이블**을 선택할 수 있습니다.
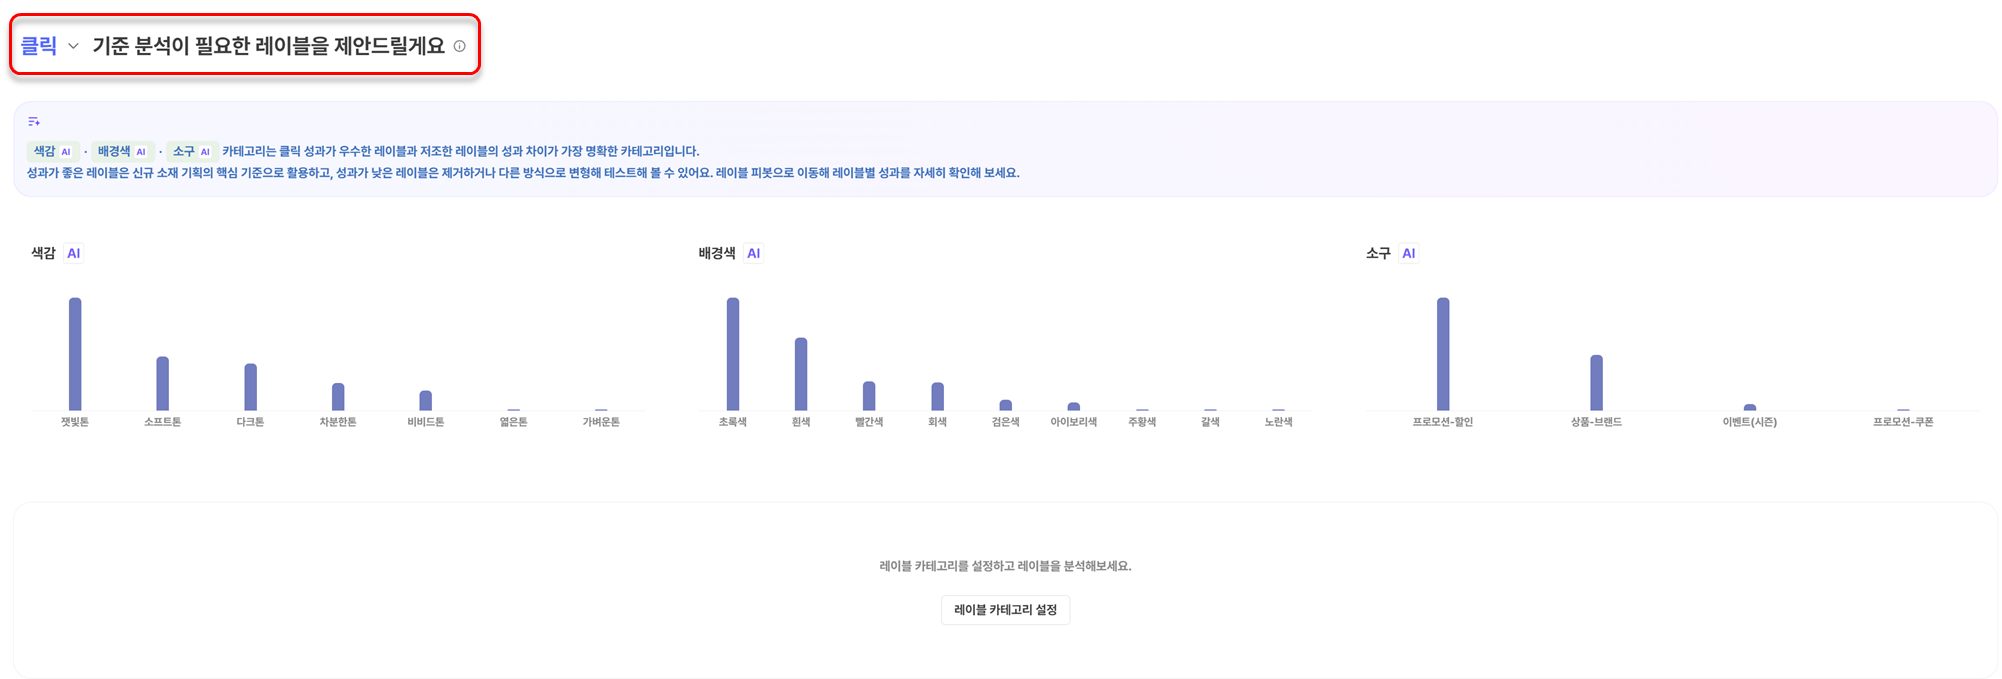
#### 레이블 카테고리 분석
* 레이블 간 **성과 차이가 크게 나타나는 카테고리**를 바 차트 형태로 제공합니다.
* 각 카테고리 내에 고효율 / 저효율 레이블이 공존하는 영역이므로, 기획에 반영할 기준을 빠르게 찾는 데 용이합니다.
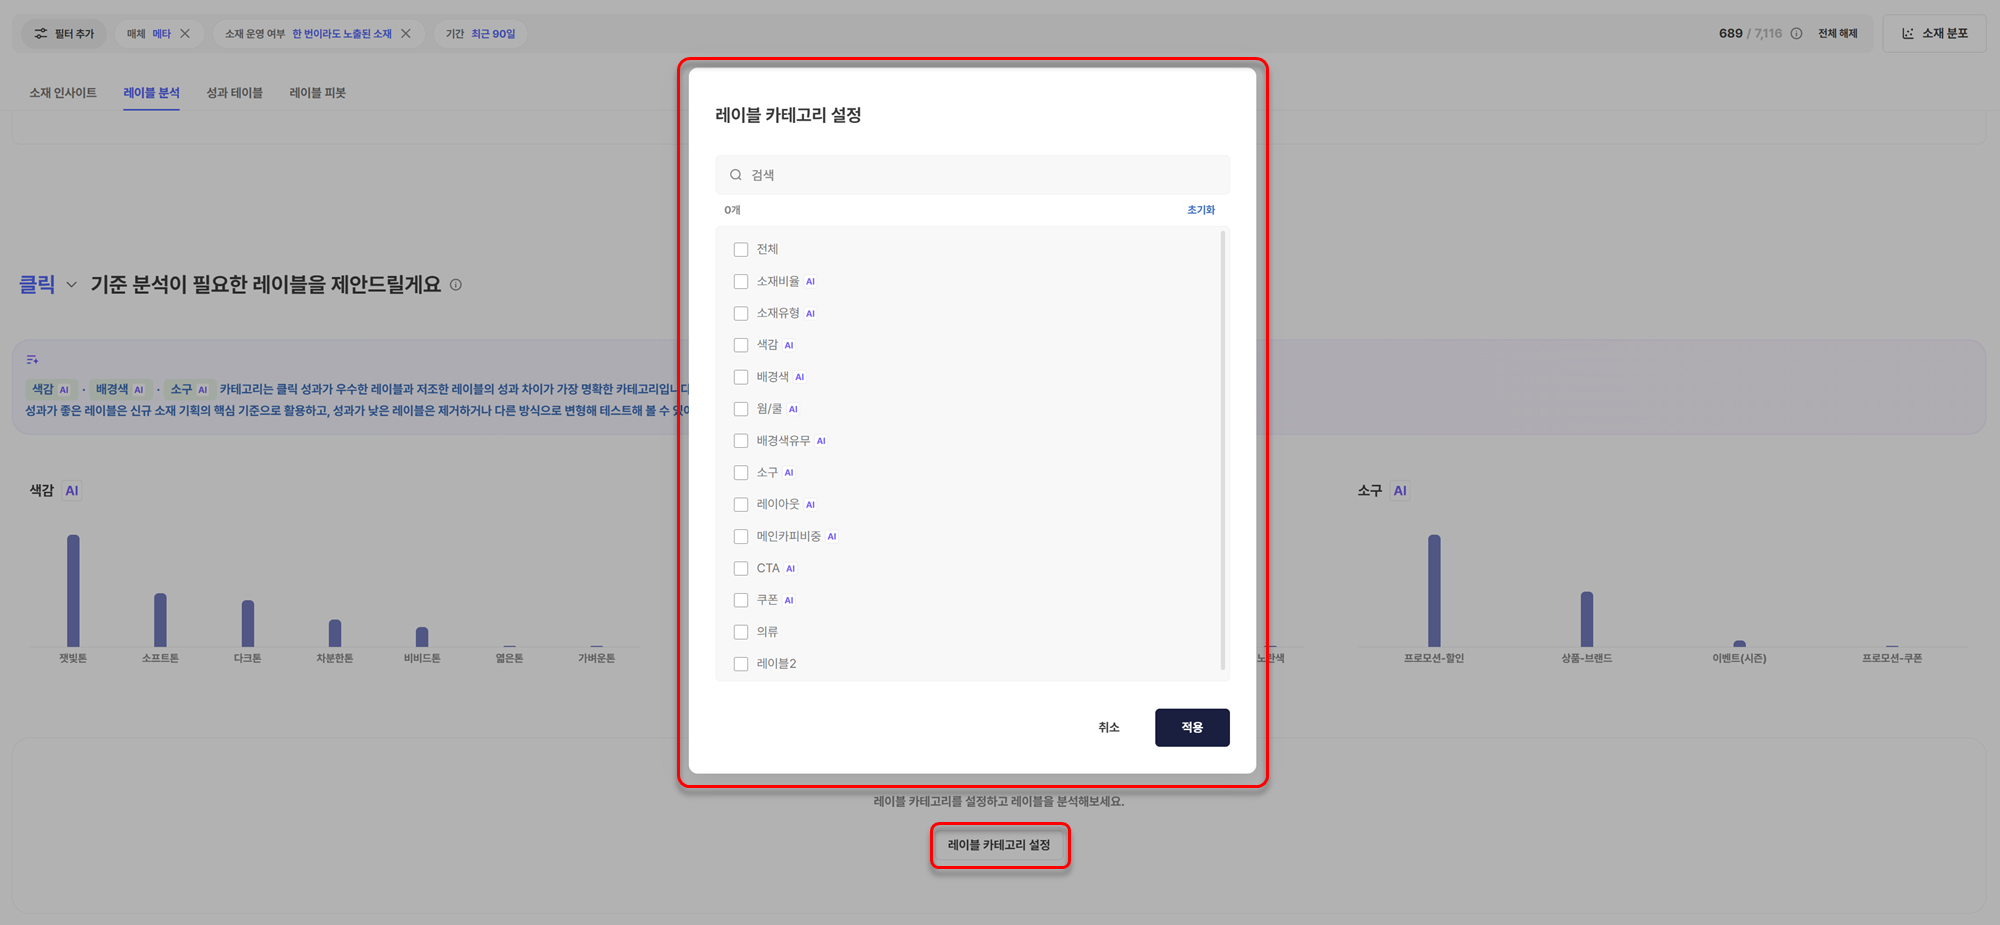
* 하단의 **\[레이블 카테고리 설정]** 버튼을 클릭 시, 현재 분석에 등록된 전체 레이블 카테고리 목록을 확인할 수 있으며 원하는 카테고리를 추가 선택하여 레이블 간 성과를 비교할 수 있습니다.
{% hint style="info" %}
레이블 수가 지나치게 적거나 많은 카테고리는 분석 정확도를 고려하여 제외되었습니다.
{% endhint %}